Constructor Schools: April 2025 update
April 30st, 2025
We’re thrilled to announce a major update to Coach — Reports are now live for both Calcularis and Grafari! Before you get started, please note a few important technical considerations:
These new reports are fully aligned with our Coach strategy. Their purpose is twofold:
Let’s begin by exploring the Calcularis reports. These are organised into two main sections:
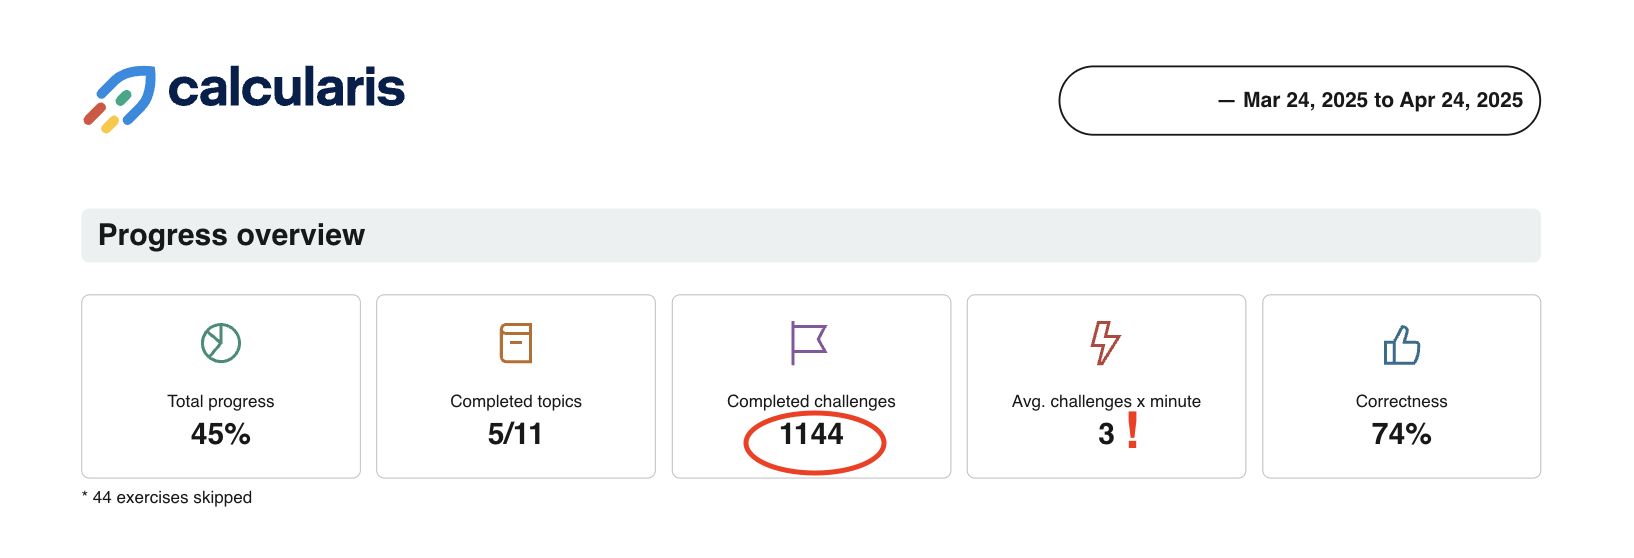
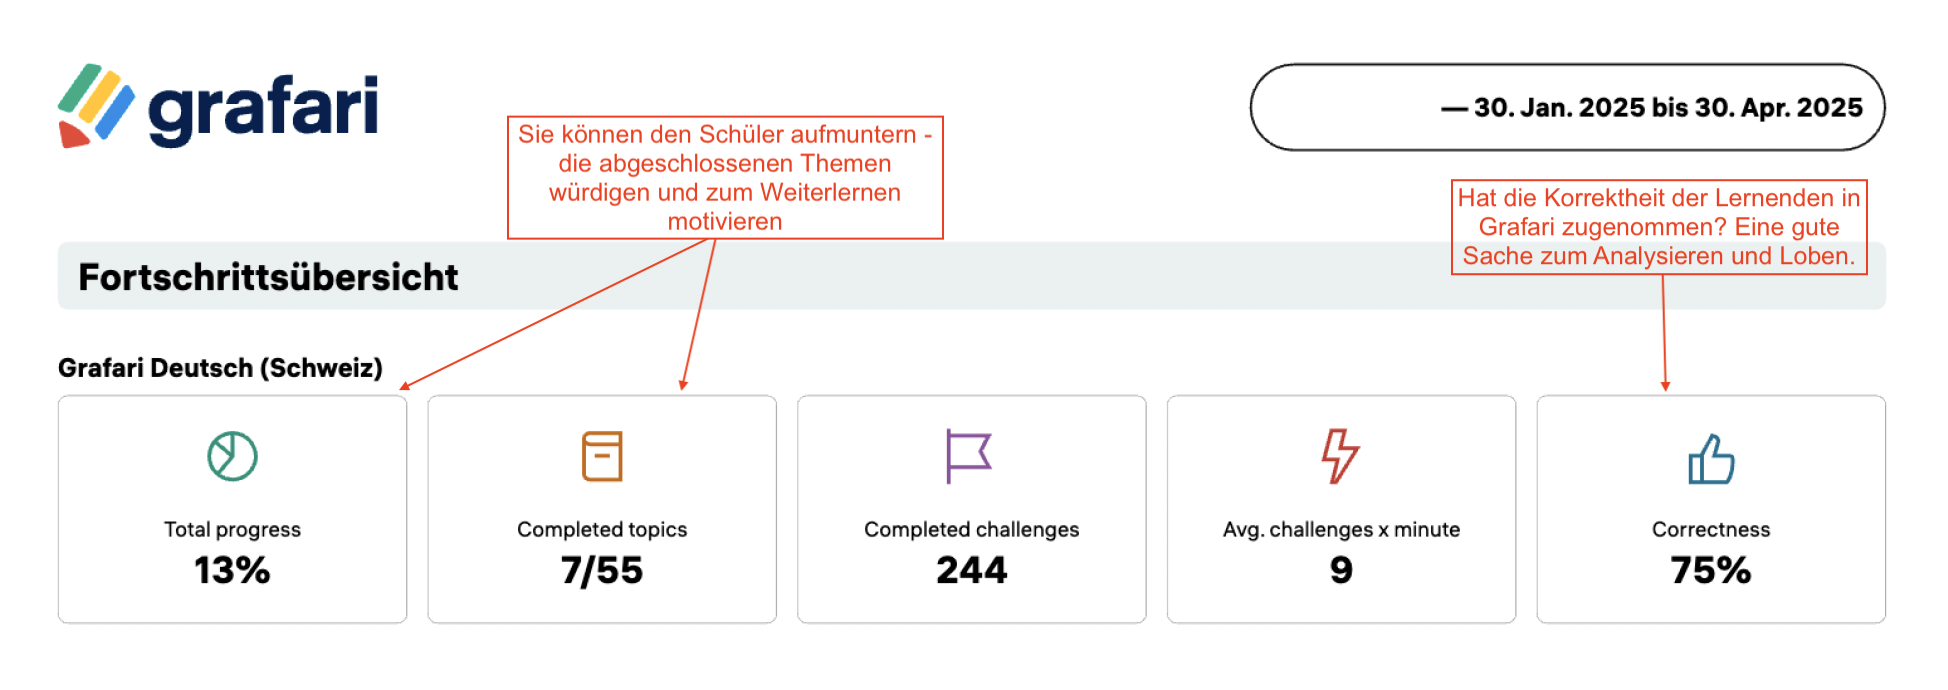
This section provides a snapshot of each learner’s overall training progress. It includes key metrics such as:
Why it matters: Children are naturally drawn to numbers—and seeing their own progress quantified can be incredibly motivating. Many teachers even highlight impressive statistics and share them with students to celebrate those “wow” moments. It's a powerful way to boost confidence and reinforce achievement.
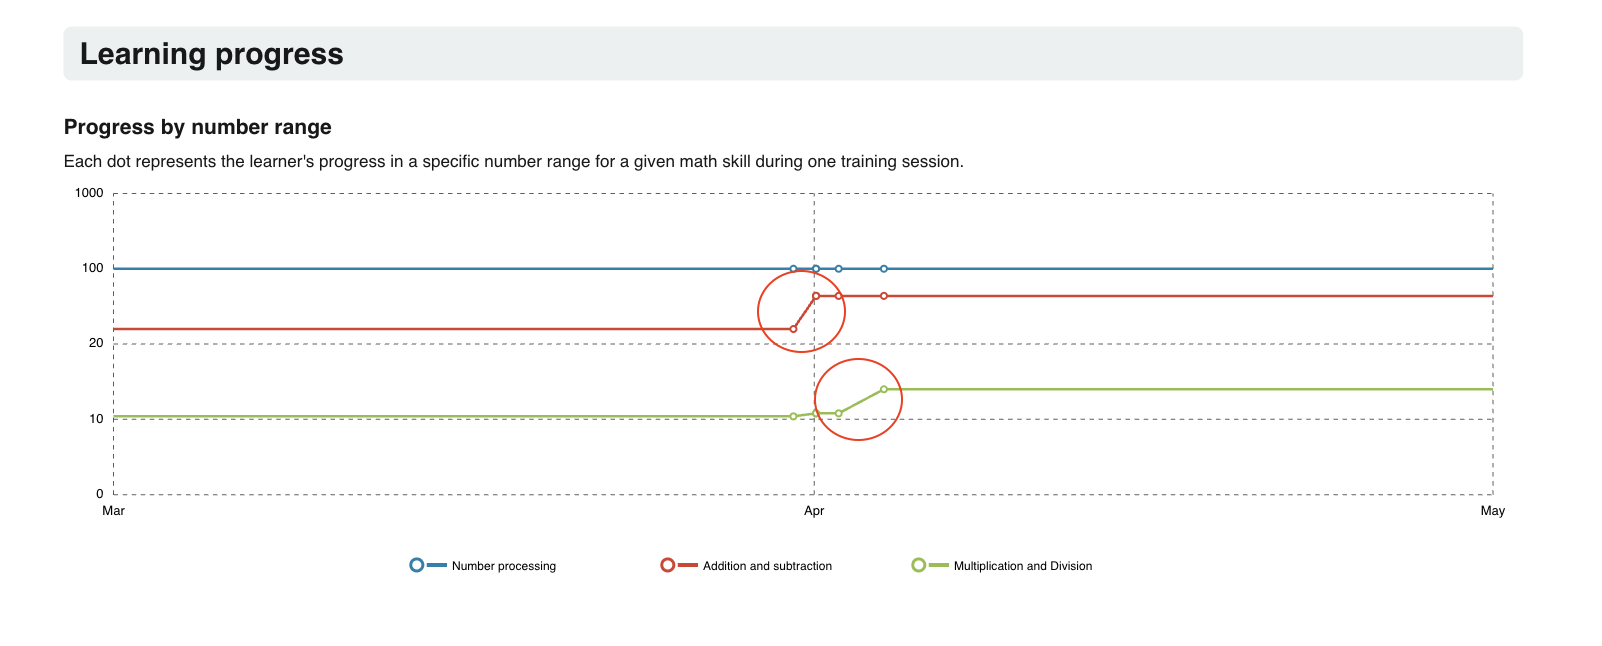
This section features a visual graph that track a learner’s progress across the three core areas of Calcularis, segmented by number ranges from 0 to 1000. The data reflects only the selected reporting period.
Why it matters: Reviewing this with your students offers a great opportunity to reflect on their learning journey. You can count the number of completed sessions and celebrate each milestone—especially when they advance into a new number range. It’s a meaningful way to recognize effort and progress.
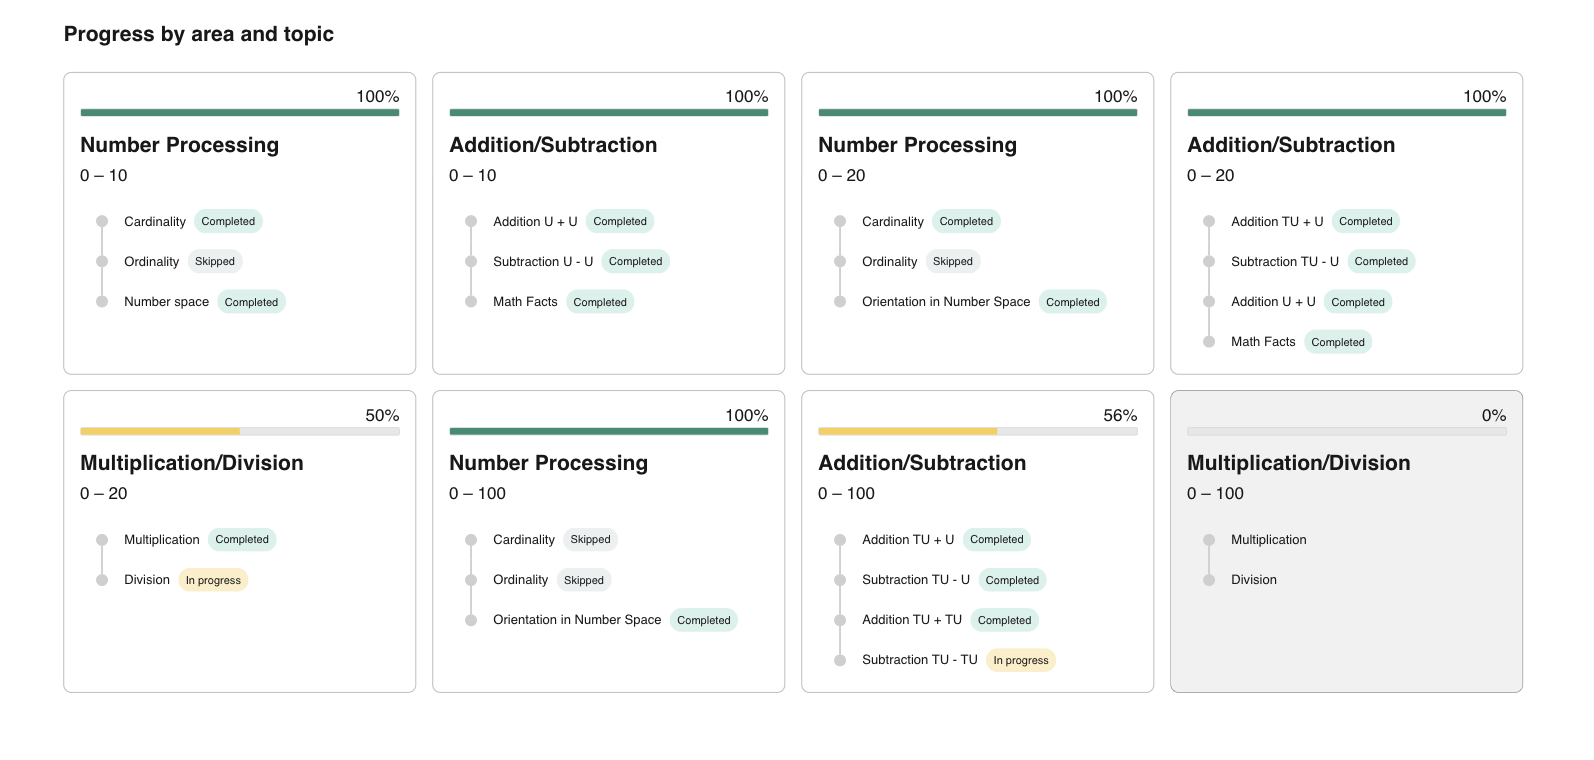
This section reflects one of the key views from Coach, offering a clear overview of the learner’s progress across different areas and topics. It highlights:
Why it matters: This is another great opportunity to celebrate progress with your students—point out fully completed areas and acknowledge how much has already been achieved. It also helps identify what remains to be done to complete the program. Use this overview to spot areas of difficulty and support learners in building consistent habits, even when progress is gradual.
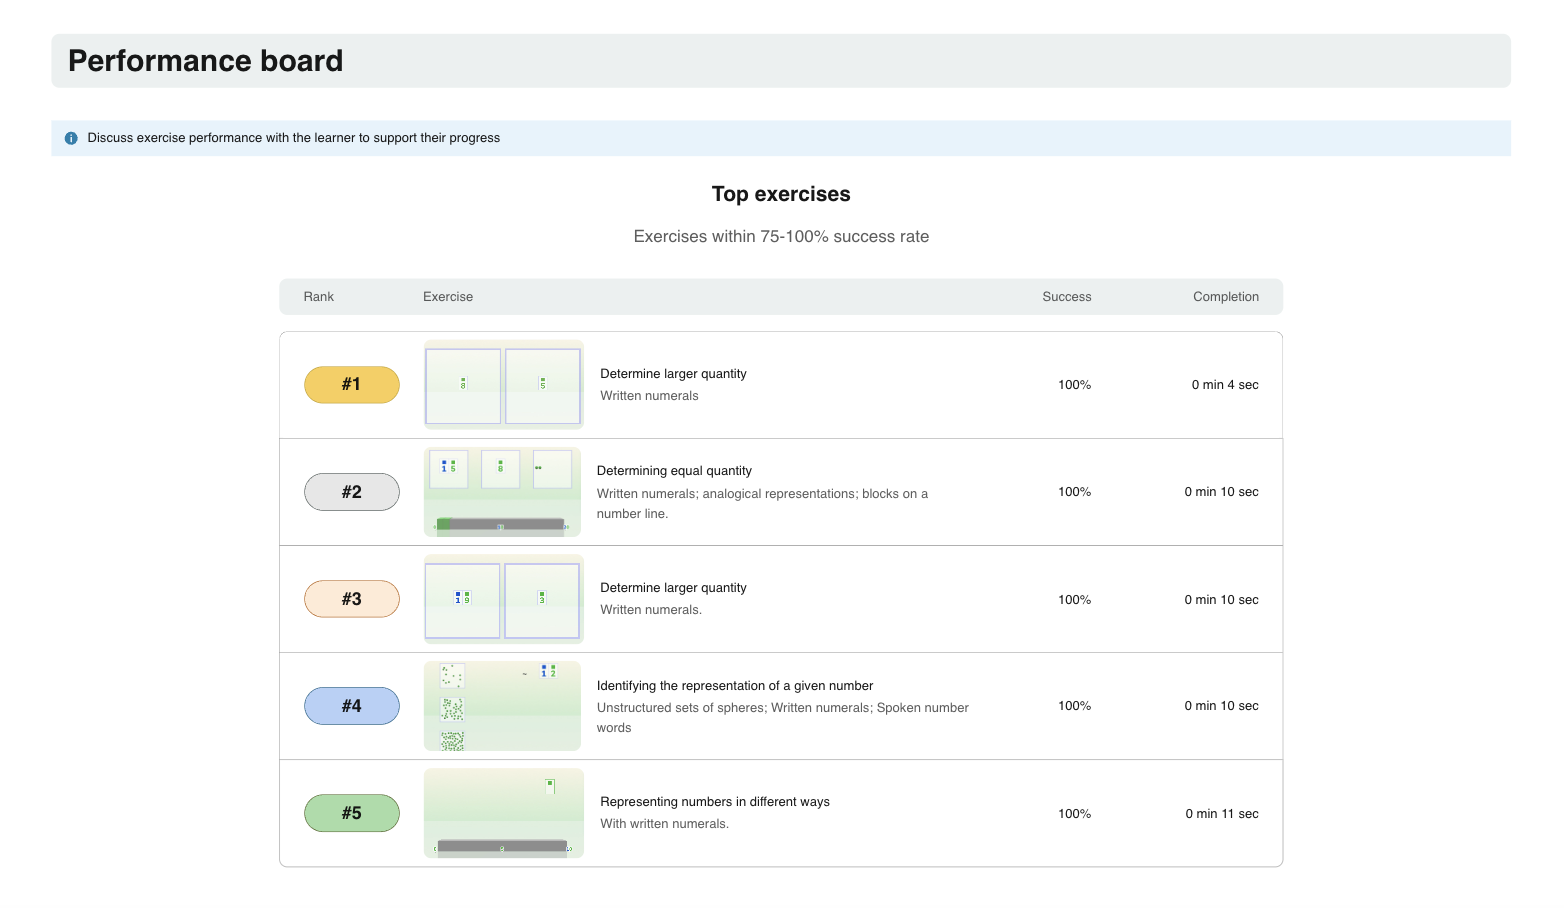
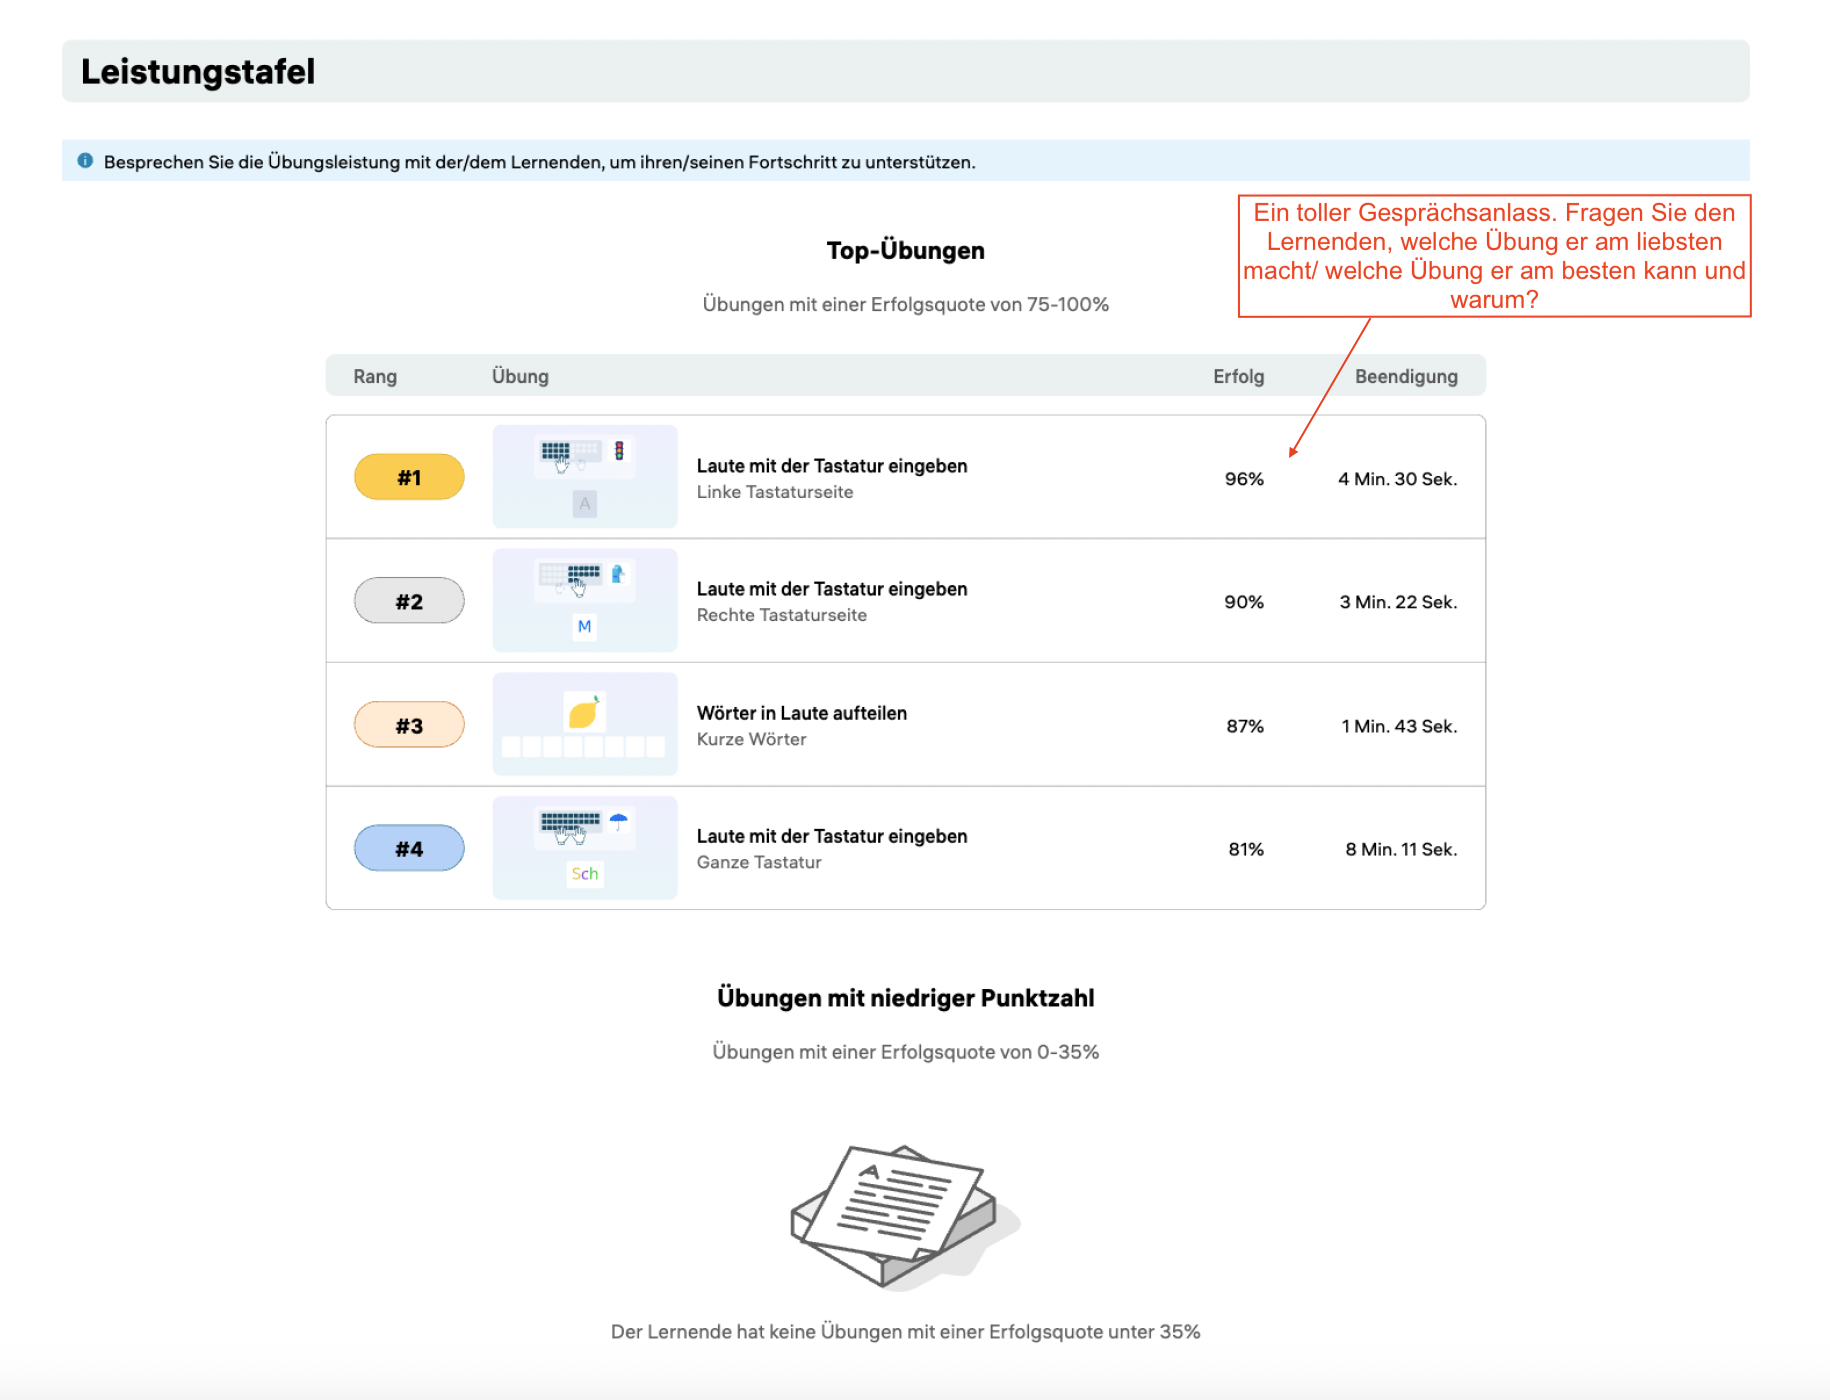
This section highlights each learner’s strongest and most challenging exercises, based on their success rate. Unique to the reports, this feature is not available as a separate page in Coach.
Why it matters: The Performance Board is a powerful tool for reflection and dialogue. Use it to spark conversations with your learners—celebrate the exercises they’ve mastered, and explore those they’ve found difficult. Ask why certain tasks are more challenging, discuss strategies for improvement, and consider whether similar difficulties arise in regular math lessons. It’s a valuable opportunity for insight and growth.
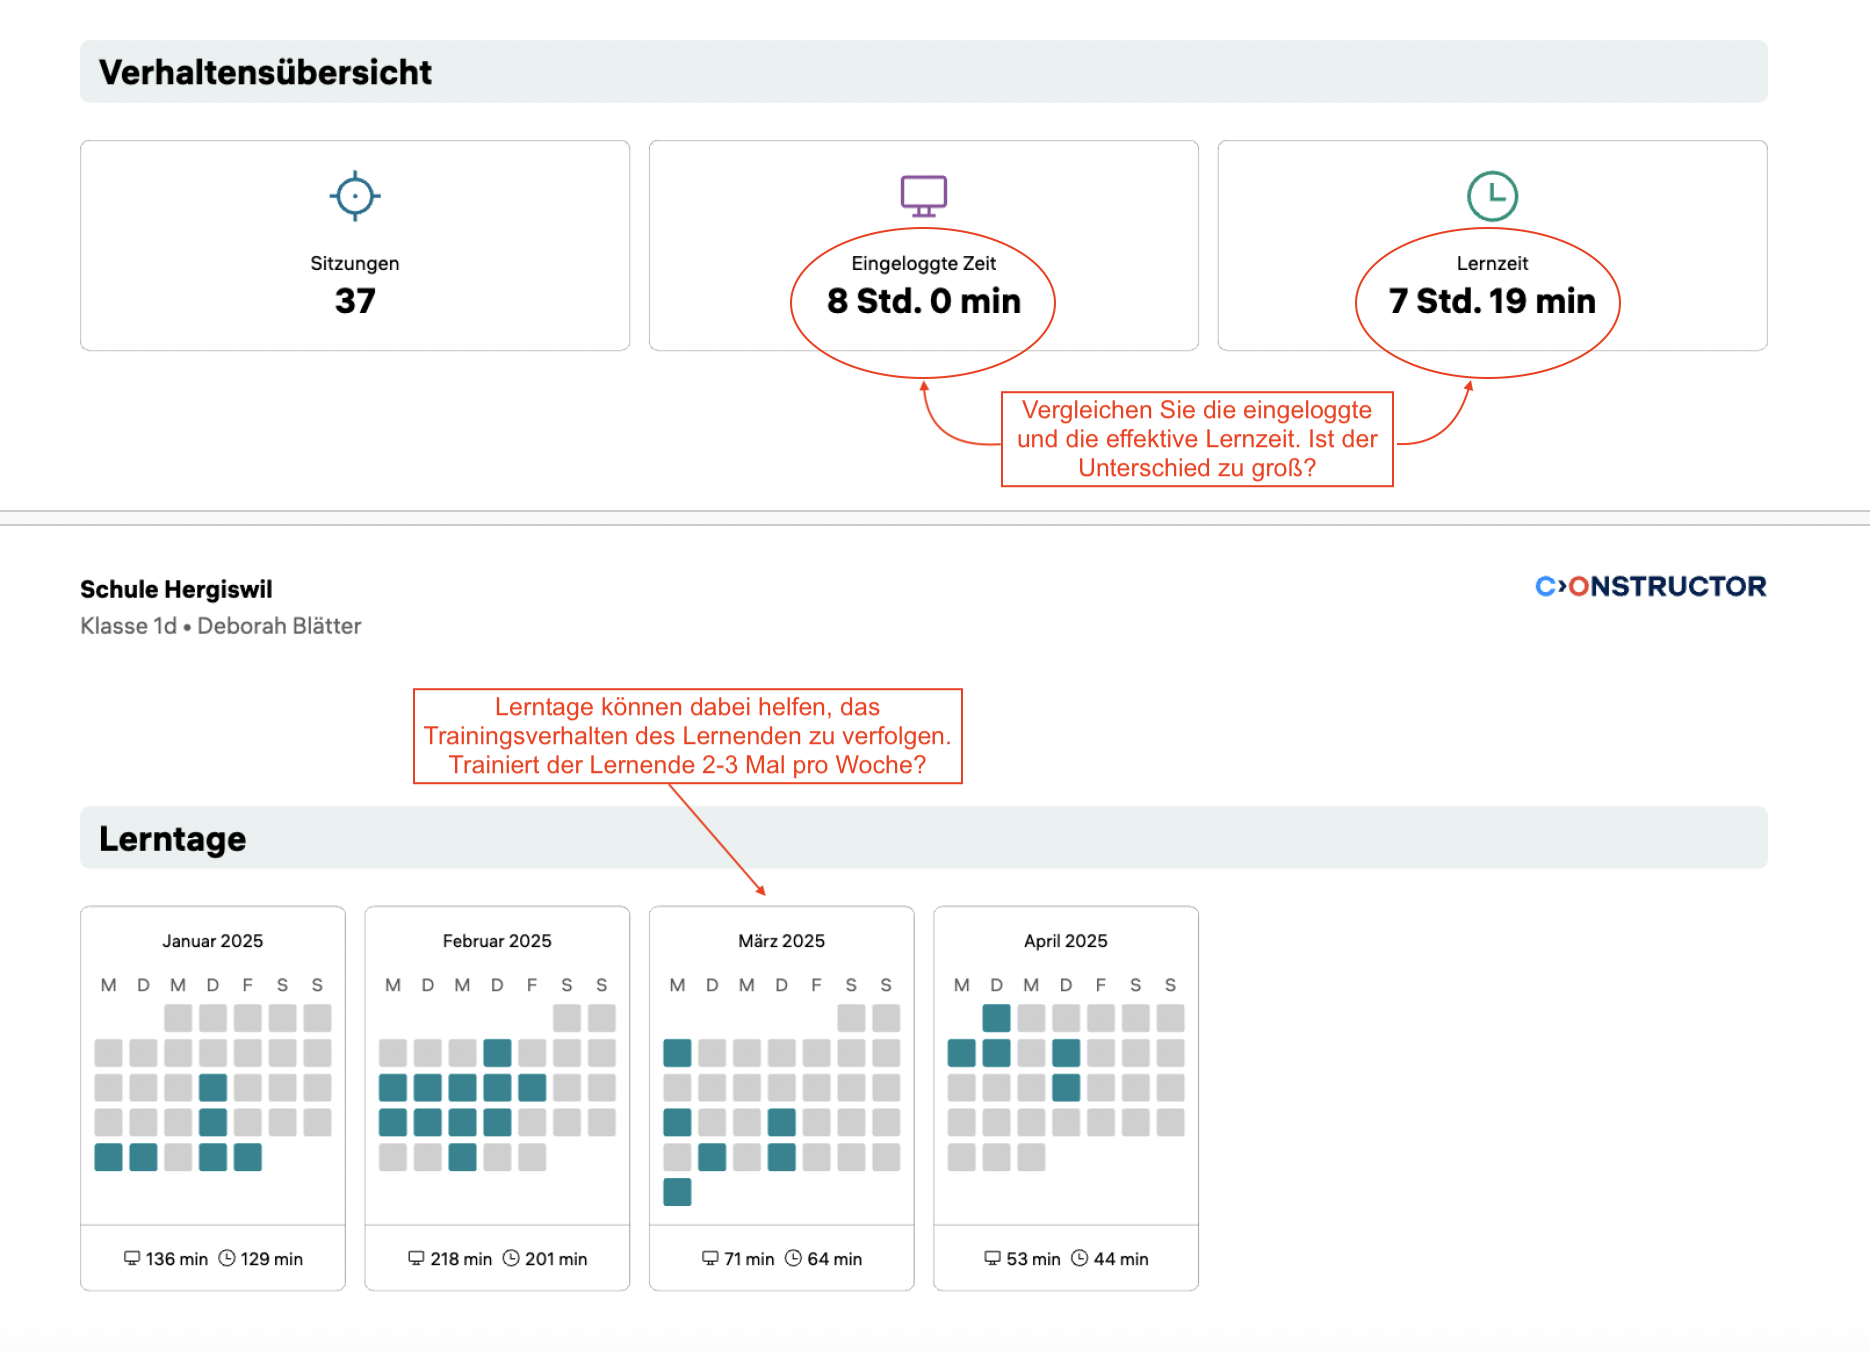
This section provides insights into the learner’s training behavior over the selected period in Calcularis. A key focus here is the comparison between total login time and effective learning time, helping you identify potentially unproductive or problematic sessions. For more detailed information on any specific session, you can refer to Coach.
Why it matters: This data can help prompt meaningful discussions with learners about their study habits. Are they getting distracted? Are there noticeable drops in engagement or focus? Use this as an opportunity to talk about when and how they train best—helping them choose time slots when they’re most alert and focused to get the most out of each session.
This section shows a visual overview of training activity across the selected time period. Each training day is marked with a color:
Orange/Red – Indicates a problematic session
Why it matters: First, it’s important to assess whether learners are training consistently, following the Calcularis recommendation of 2–3 sessions per week. Irregular training patterns can affect progress, so this is a good place to guide students on building regular study habits. If you notice a high number of problematic sessions, consider the possible causes—was it due to inattention, lack of engagement, or unusually low accuracy? Again, Coach provides more detailed insights into each session to support your analysis and conversations with learners.
This section provides a snapshot of each learner’s overall training progress. It includes key metrics such as:
Why it matters: Children are naturally drawn to numbers—and seeing their own progress quantified can be incredibly motivating. Many teachers even highlight impressive statistics and share them with students to celebrate those “wow” moments. It's a powerful way to boost confidence and reinforce achievement.
This section highlights each learner’s strongest and most challenging exercises, based on their success rate. Unique to the reports, this feature is not available as a separate page in Coach.
Why it matters: The Performance Board is a powerful tool for reflection and dialogue. Use it to spark conversations with your learners—celebrate the exercises they’ve mastered, and explore those they’ve found difficult. Ask why certain tasks are more challenging, discuss strategies for improvement, and consider whether similar difficulties arise in regular math lessons. It’s a valuable opportunity for insight and growth.
This section reflects one of the key views from Coach, offering a clear overview of the learner’s progress across different areas and topics. It highlights:
Why it matters: This is another great opportunity to celebrate progress with your students—point out fully completed areas and acknowledge how much has already been achieved. It also helps identify what remains to be done to complete the program. Use this overview to spot areas of difficulty and support learners in building consistent habits, even when progress is gradual.
This section provides insights into the learner’s training behavior over the selected period in Calcularis. A key focus here is the comparison between total login time and effective learning time, helping you identify potentially unproductive or problematic sessions. For more detailed information on any specific session, you can refer to Coach.
Why it matters: This data can help prompt meaningful discussions with learners about their study habits. Are they getting distracted? Are there noticeable drops in engagement or focus? Use this as an opportunity to talk about when and how they train best—helping them choose time slots when they’re most alert and focused to get the most out of each session.
This section shows a visual overview of training activity across the selected time period. Each training day is marked with a color:
Orange/Red – Indicates a problematic session
Why it matters: First, it’s important to assess whether learners are training consistently, following the Calcularis recommendation of 2–3 sessions per week. Irregular training patterns can affect progress, so this is a good place to guide students on building regular study habits. If you notice a high number of problematic sessions, consider the possible causes—was it due to inattention, lack of engagement, or unusually low accuracy? Again, Coach provides more detailed insights into each session to support your analysis and conversations with learners.
1. Generate and Review Reports Regularly (Every 1–3 Months) We recommend generating reports at regular intervals—ideally every 1 or 3 months. Shorter timeframes make it easier to monitor progress, detect patterns early, and keep learners motivated by celebrating recent achievements. Reports covering extended periods (e.g., more than 3 months) can become overwhelming and less informative.
2. Review Reports with Students Section by Section. Use a structured approach to go through the report together: Start with Progress Overview to celebrate overall achievements Move to Number Range or Topic Progress (depending on the application) to track academic growth Discuss the Performance Board to reflect on strengths and challenges Review Behavior Overview and Learning Days to evaluate training habits This step-by-step method helps learners process feedback in manageable parts.
3. Use Reports as Communication Tools with Parents. Sharing reports with parents helps keep them informed and engaged. Encourage parents to discuss the report with their child and support training with the applications at home. It fosters a consistent support system between school and home.
4. Use Reports to Set Personal Learning Goals. After each review, set one or two small, achievable goals with the student (e.g., “Let’s try to move into the next number range,” or “Let’s reduce problematic sessions next month”). This builds a growth mindset and a sense of ownership.
5. Discuss Behavioral Patterns and Study Habits. Use the Behavior Overview to identify trends—like frequent distractions or irregular
6. Celebrate Milestones Visibly. When students reach new number ranges or complete topics, mark the occasion. Display a “Calcularis/ Grafari Progress Wall” in class or use stickers on printed reports. Recognition builds confidence and encourages consistent effort.
7. Compare Current and Previous Reports to Show Growth. Reviewing previous reports side-by-side with the latest one can help visualize progress over time. It’s particularly motivating for students who feel they’re improving slowly—data shows otherwise.
8. Use Reports to Tailor Instruction and Support. Identify learners who may be struggling with specific topics or showing declining engagement. Use this insight to personalize interventions, offer additional practice to the learners with learning difficulties, or adapt your teaching strategy.
Duration: ~10–15 minutes Setting: One-on-one, calm environment Goal: Reflect on progress, reinforce motivation, and set small goals
1. Warm Welcome & Set the Tone (1–2 minutes)
Teacher: "Hi [Name], today we’re going to look at your Calcularis/ Grafari report together! It shows all the great work you’ve been doing—and helps us see how to make your learning even better. Ready?"
2. Start with Progress Overview (2–3 minutes) Open the Progress Overview section.
Teacher: "Look at this! You’ve completed [X] out of [Y] topics and finished [Z] challenges. That’s a lot of learning!"
Possible questions to ask: "Which part are you most proud of?" "Did you notice any topic that felt easier recently?" Celebrate any wins. Highlight high correctness rate or steady activity.
3. (Only for Calcularis) Explore Progress by Number Range (2–3 minutes) Show the visual graphs. Teacher: "Here we can see the number ranges you've been working in. Look—you moved from [range] to [range]! That shows your number sense is really growing."
Possible questions to ask: "Do you remember when this happened? What helped you get there?" This connects effort with outcome.
4. Review Progress by Topic (2–3 minutes) Teacher: "This shows all the topics you’ve started and completed. Look how much green there is!"
Possible questions to ask: "Is there a topic here that felt tricky or took a bit longer?" "Which topic would you like to finish next?"
5. Performance Board (1–2 minutes) Show best and “worst” exercises. Teacher: "These are the exercises where you did really well—and the ones where there’s room to grow. Why do you think some were harder?"
Possible questions to ask: "Was it the type of task? Was it hard to focus?" "What could help next time—taking a short break? Taking more time to complete the task?"
6. Behavior & Learning Days (2–3 minutes) Teacher: "Let’s check your training pattern. You’ve been training on [X] days. Green means sessions went well. See any red or orange?". Possible questions to ask: "What was going on that day? Were you tired or distracted?" "When do you feel most focused—morning or afternoon?" Use it to improve future learning conditions.
7. Wrap Up with Encouragement and Goal-Setting (1–2 minutes) Teacher: "You’ve done so much already! Let’s set one small goal before our next report—what would you like to work on?" Help them choose something concrete: Complete a topic Improve focus Increase correctness Teacher: "I’ll check in with you, and we’ll celebrate your next steps in Calcularis/ Grafari together. You’re doing a great job!"


