From research to the classroom: Constructor Tech relies on scientifically grounded innovation
05 November, 2026


Constructor Tech / Research & innovation
Fewer clicks. More understanding. More targeted support. Constructor Tech and PH Zurich present research results from the Lighthouse EdTech Initiative with the Jacobs Foundation and EPFL.
When cutting-edge research, educational technology and school practice come together, innovation with real impact emerges. The Lighthouse EdTech Initiative brought universities, EdTech companies and schools together to study digital learning solutions under real conditions.
Among the participants: Constructor Tech and the Zurich University of Teacher Education (PHZH). Together they examined how the Calcularis dashboard gives teachers fast and meaningful access to learning information. The collaboration stands for a clear commitment: aligning digital innovation consistently with schools' needs and verifying it scientifically.
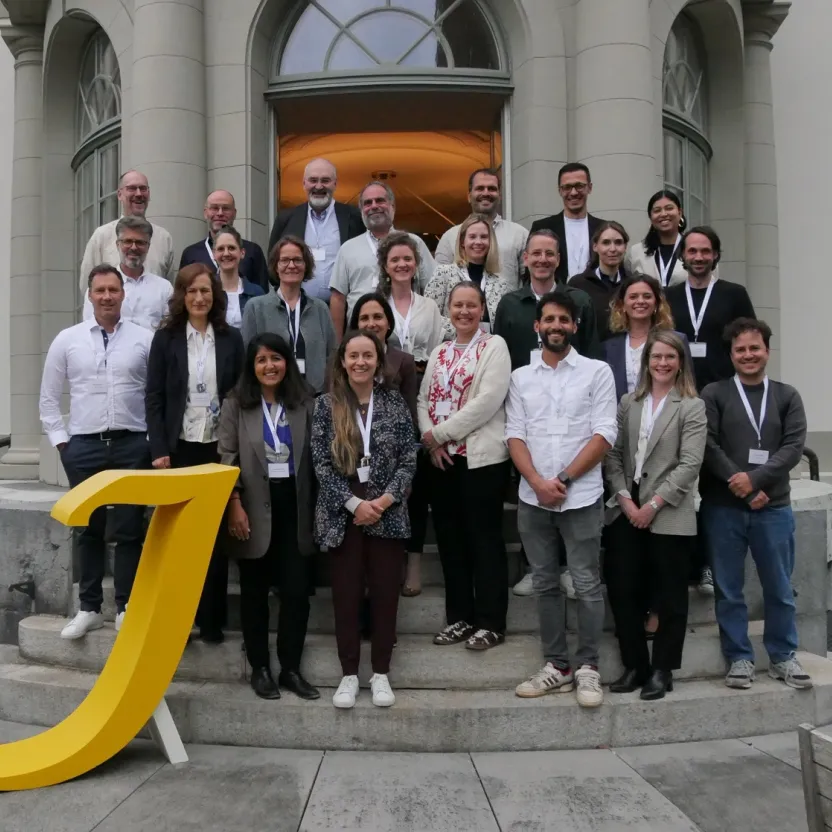
At the closing event on 24 September 2026 at the Jacobs House in Zurich, the project teams shared their findings. For Constructor Tech, taking part marks an important step in connecting research, product development and concrete benefits for primary schools.
Closing event of the Lighthouse EdTech Initiative | Photo: Jacobs Foundation
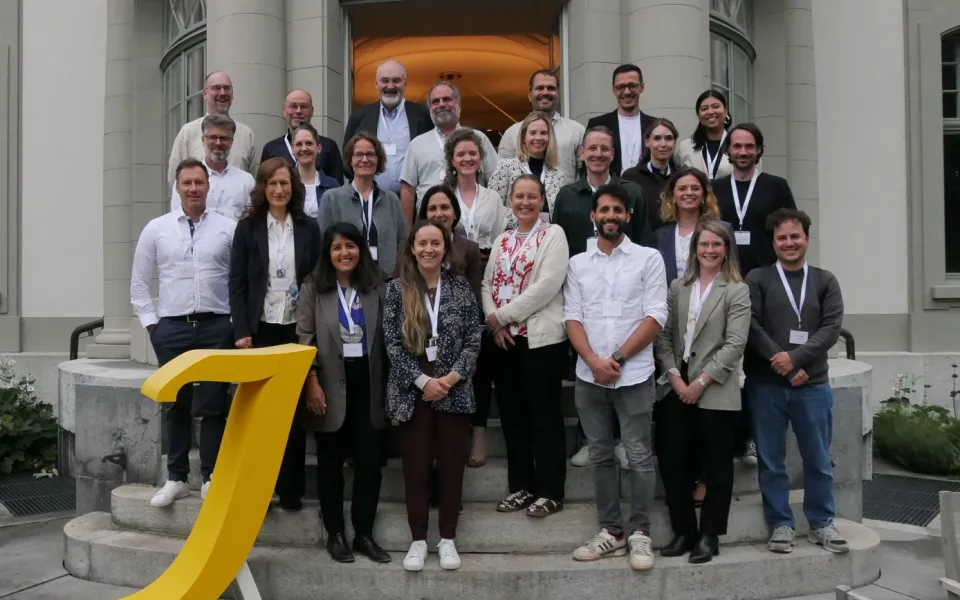
Insights into the presentations and the professional exchange at the closing event. Photos: Jacobs Foundation.
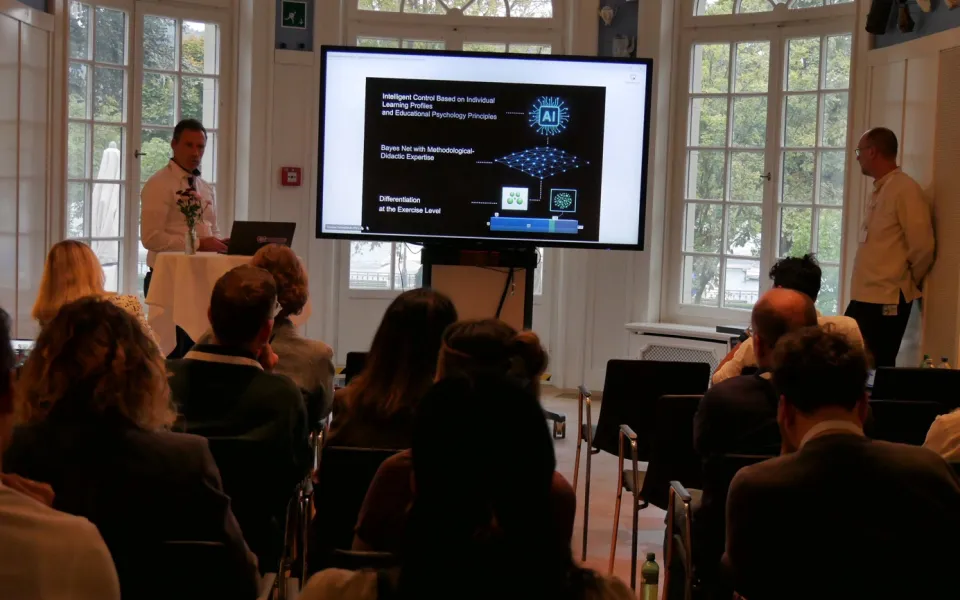
Insights into the presentations and the professional exchange at the closing event. Photos: Jacobs Foundation.
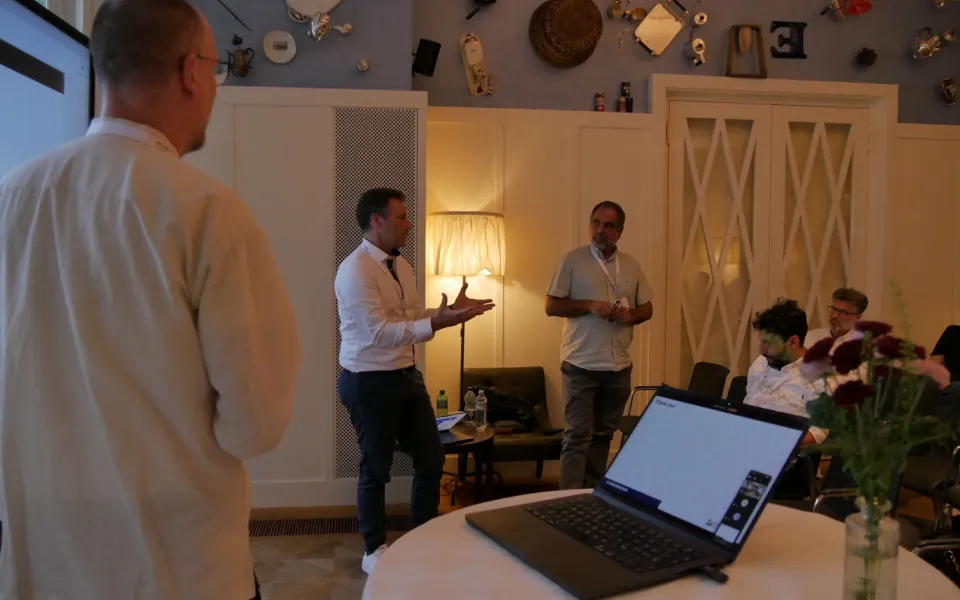
Constructor Tech / Scientific results
Fewer clicks. More understanding. More targeted support.
How can teachers quickly see what their pupils have worked on, where they stand in their learning and where targeted support can start? That is exactly what the Constructor dashboard was developed for: relevant information on learning activities, learning level and learning behaviour should be accessible with as few targeted clicks as possible – instead of remaining hidden in complex statistics.
In the research project, PH Zurich and Constructor Tech analysed 128,591 logged interactions. For the evaluation, these were grouped into 18,320 usage sequences; a new sequence began after five minutes of inactivity. Additional interviews helped to put the observed patterns into a practical context.
The remarkable result: 91.9% of sequences were short routine check-ins. In this group, the median was just three recorded interactions. Teachers most often checked which learning activities their pupils had completed. This dominant usage pattern surprised the project team as well.
| Cluster 1 | Cluster 2 | Cluster 3 | Cluster 4 | |
|---|---|---|---|---|
| Name | Exploratory navigation | Routine micro-sessions | Temporal management | Targeted problem resolution |
| n (%) | 714 (3.9%) | 16,838 (91.9%) | 626 (3.4%) | 142 (0.8%) |
| Median length | 22 | 3 | 17 | 41 |
| Dominant event | open-activity-day-popover | — | change-activity-period | mark-problem-as-resolved |
| Key signature | check how long students worked | check what students worked on | check students' work over time | final check of students' work |
Original analysis by PHZH / Constructor Tech: four usage patterns; 91.9% routine micro-sessions.
The scientific figure only gains its value through what it means in the classroom: teachers mainly use the dashboard for a short, focused look at their learners' work. They can call up relevant activity information in just a few steps – and this quick orientation was a central development goal.
The dashboard goes further: it presents the learning analytics of the adaptive learning programs so that teachers can track learning progress, assess learning levels, spot patterns in learning behaviour and prepare support decisions in a more targeted way. In particular, the study shows that short routine check-ins shape actual everyday use.
Scientifically precise: the study measures interaction sequences and usage patterns. It does not prove for every check-in that all information on learning level or learning behaviour was fully understood in exactly 1–3 clicks. The median of three recorded interactions refers to the cluster of short routine check-ins.
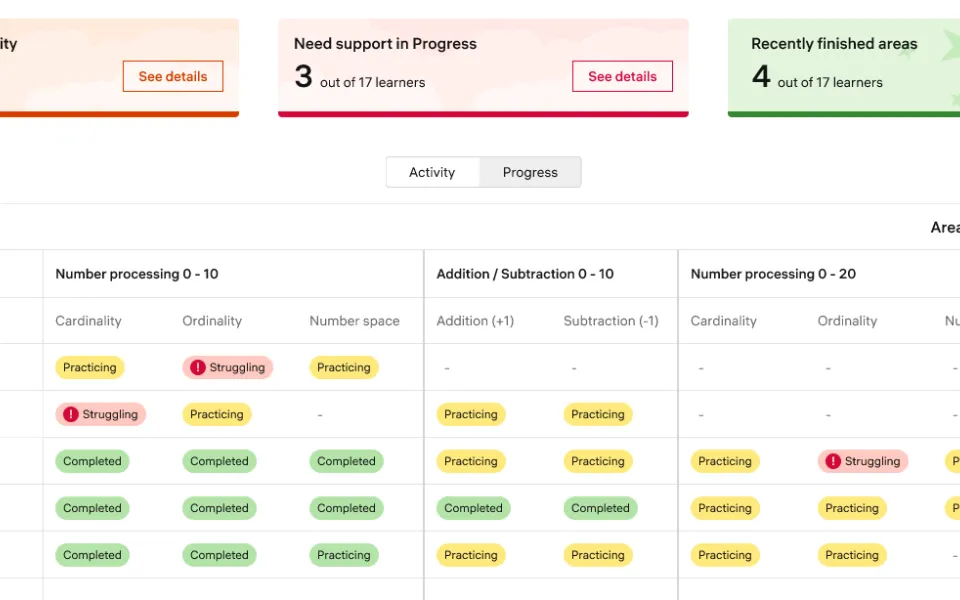
A look at the teacher view of the Calcularis dashboard.
At a glance: which learners need support with their activity or learning progress?
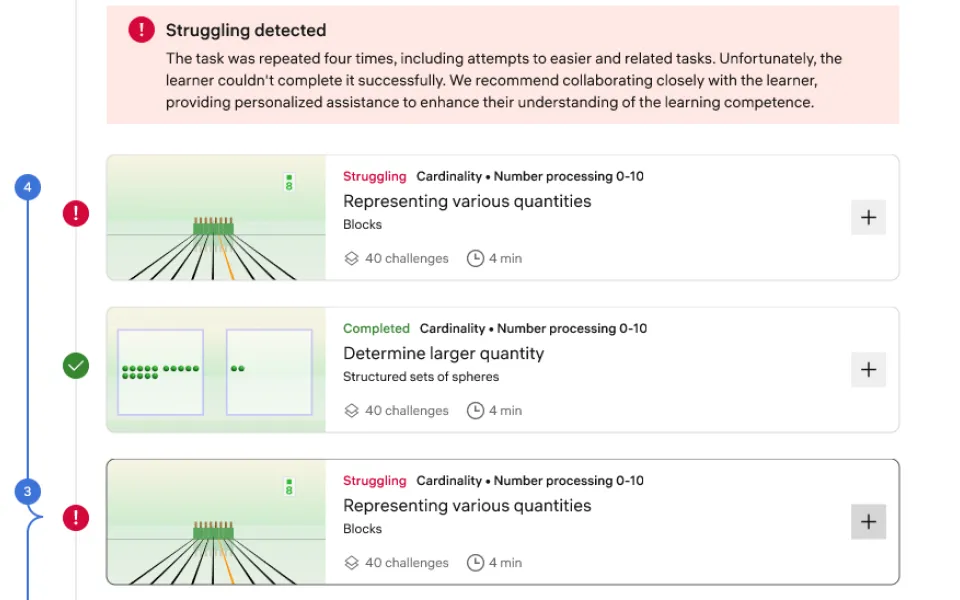
The dashboard flags tasks a child could not complete and recommends personal support.
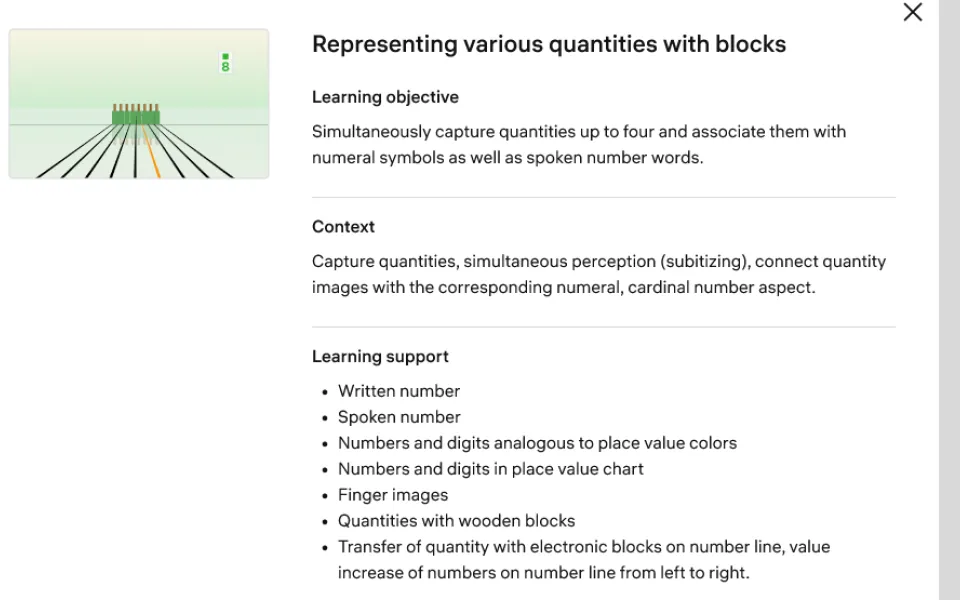
For every task, the dashboard shows the learning objective, context and learning support.
For further development, this result is particularly valuable. For the first time, it provides this dashboard with a broad empirical basis on which paths teachers actually take. The consequence is clear: keep key information quickly accessible, avoid unnecessary navigation and offer in-depth analyses where they are needed.
Original graphic from the usage analysis: distribution of states and sequence patterns.
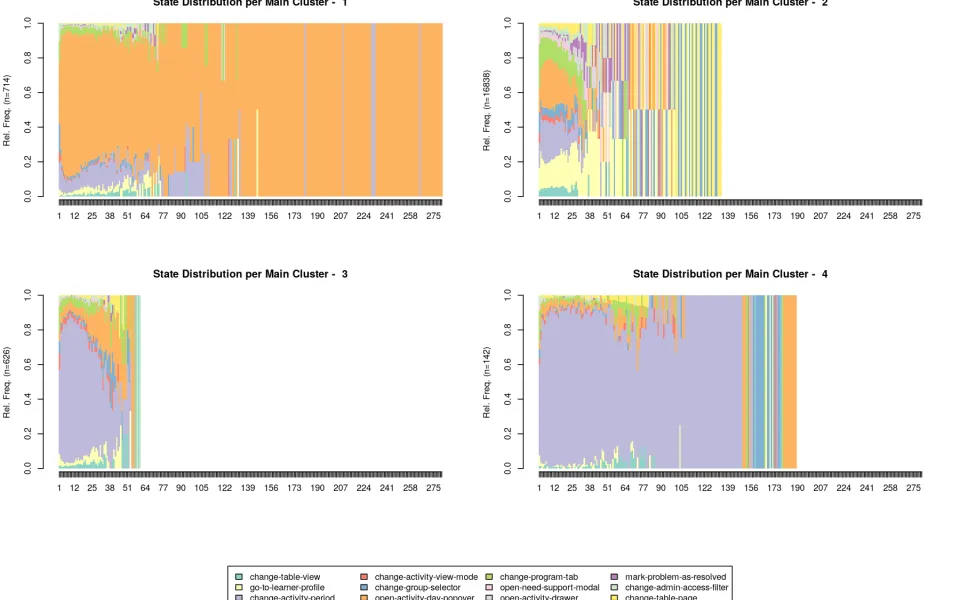
Original graphic from the usage analysis: transitions between dashboard interactions.
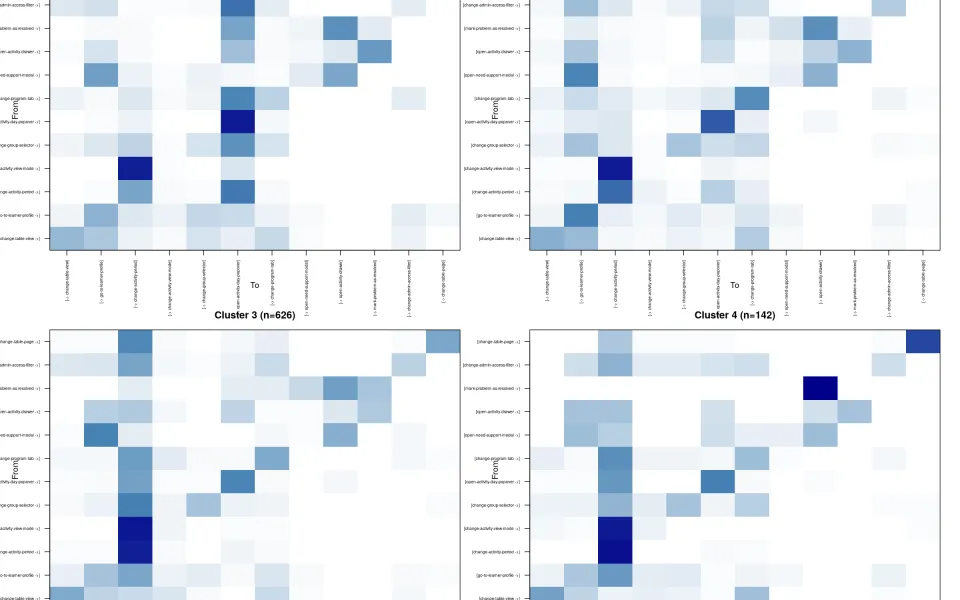
With this research project, the Constructor dashboard may be among the first scientifically studied learning analytics dashboards for Swiss primary schools. An important milestone for Constructor Tech and for the evidence-based development of digital learning technologies.
What sets Constructor Tech apart: innovative learning technologies are not only developed close to practice, but also scientifically studied under real classroom conditions and continuously improved.
Fewer clicks. More understanding. More targeted support.
Research and project partners: Zurich University of Teacher Education (PHZH) and Constructor Tech as part of the Lighthouse EdTech Initiative of the Jacobs Foundation and EPFL.
Image credits: closing event © Jacobs Foundation | research figures: PHZH / Constructor Tech.
Would you like to see how learning data can support your teaching? We plan a tailored pilot with you for your school, municipality or canton.